Gartner’s 2019 Take on Data Science Software
Want to share your content on python-bloggers? click here.
I’ve just updated The Popularity of Data Science Software to reflect my take on Gartner’s 2019 report, Magic Quadrant for Data Science and Machine Learning Platforms. To save you the trouble of digging through all 40+ pages of my report, here’s just the updated section:
IT Research Firms
IT research firms study software products and corporate strategies. They survey customers regarding their satisfaction with the products and services and provide their analysis in reports that they sell to their clients. Each research firm has its own criteria for rating companies, so they don’t always agree. However, I find the detailed analysis that these reports contain extremely interesting reading. The reports exclude open source software that has no specific company backing, such as R, Python, or jamovi. Even open source projects that do have company backing, such as BlueSky Statistics, are excluded if they have yet to achieve sufficient market adoption. However, they do cover how company products integrate open source software into their proprietary ones.
While these reports are expensive, the companies that receive good ratings usually purchase copies to give away to potential customers. An Internet search of the report title will often reveal companies that are distributing them. On the date of this post, Datarobot is offering free copies.
Gartner, Inc. is one of the research firms that write such reports. Out of the roughly 100 companies selling data science software, Gartner selected 17 which offered “cohesive software.” That software performs a wide range of tasks including data importation, preparation, exploration, visualization, modeling, and deployment.
Gartner analysts rated the companies on their “completeness of vision” and their “ability to execute” that vision. Figure 3a shows the resulting “Magic Quadrant” plot for 2019, and 3b shows the plot for the previous year. Here I provide some commentary on their choices, briefly summarize their take, and compare this year’s report to last year’s. The main reports from both years contain far more detail than I cover here.

Figure 3a. Gartner Magic Quadrant for Data Science and Machine Learning Platforms from their 2019 report (plot done in November 2018, report released in 2019).
The Leaders quadrant is the place for companies whose vision is aligned with their customer’s needs and who have the resources to execute that vision. The further toward the upper-right corner of the plot, the better the combined score.
- RapidMiner and KNIME reside in the best part of the Leaders quadrant this year and last. This year RapidMiner has the edge in ability to execute, while KNIME offers more vision. Both offer free and open source versions, but the companies differ quite a lot on how committed they are to the open source concept. KNIME’s desktop version is free and open source and the company says it will always be so. On the other hand, RapidMiner is limited by a cap on the amount of data that it can analyze (10,000 cases) and as they add new features, they usually come only via a commercial license with “difficult-to-navigate pricing conditions.” These two offer very similar workflow-style user interfaces and have the ability to integrate many open sources tools into their workflows, including R, Python, Spark, and H2O.
- Tibco moved from the Challengers quadrant last year to the Leaders this year. This is due to a number of factors, including the successful integration of all the tools they’ve purchased over the years, including Jaspersoft, Spotfire, Alpine Data, Streambase Systems, and Statistica.
- SAS declined from being solidly in the Leaders quadrant last year to barely being in it this year. This is due to a substantial decline in its ability to execute. Given SAS Institute’s billions in revenue, that certainly can’t be a financial limitation. It may be due to SAS’ more limited ability to integrate as wide a range of tools as other vendors have. The SAS language itself continues to be an important research tool among those doing complex mixed-effects linear models. Those models are among the very few that R often fails to solve.
The companies in the Visionaries Quadrant are those that have good future plans but which may not have the resources to execute that vision.
- Mathworks moved forward substantially in this quadrant due to MATLAB’s ability to handle unconventional data sources such as images, video, and the Internet of Things (IoT). It has also opened up more to open source deep learning projects.
- H2O.ai is also in the Visionaries quadrant. This is the company behind the open source H2O software, which is callable from many other packages or languages including R, Python, KNIME, and RapidMiner. While its own menu-based interface is primitive, its integration into KNIME and RapidMiner makes it easy to use for non-coders. H2O’s strength is in modeling but it is lacking in data access and preparation, as well as model management.
- IBM dropped from the top of the Visionaries quadrant last year to the middle. The company has yet to fully integrate SPSS Statistics and SPSS Modeler into its Watson Studio. IBM has also had trouble getting Watson to deliver on its promises.
- Databricks improved both its vision and its ability to execute, but not enough to move out of the Visionaries quadrant. It has done well with its integration of open-source tools into its Apache Spark-based system. However, it scored poorly in the predictability of costs.
- Datarobot is new to the Gartner report this year. As its name indicates, its strength is in the automation of machine learning, which broadens its potential user base. The company’s policy of assigning a data scientist to each new client gets them up and running quickly.
- Google’s position could be clarified by adding more dimensions to the plot. Its complex collection of a dozen products that work together is clearly aimed at software developers rather than data scientists or casual users. Simply figuring out what they all do and how they work together is a non-trivial task. In addition, the complete set runs only on Google’s cloud platform. Performance on big data is its forte, especially problems involving image or speech analysis/translation.
- Microsoft offers several products, but only its cloud-only Azure Machine Learning (AML) was comprehensive enough to meet Gartner’s inclusion criteria. Gartner gives it high marks for ease-of-use, scalability, and strong partnerships. However, it is weak in automated modeling and AML’s relation to various other Microsoft components is overwhelming (same problem as Google’s toolset).
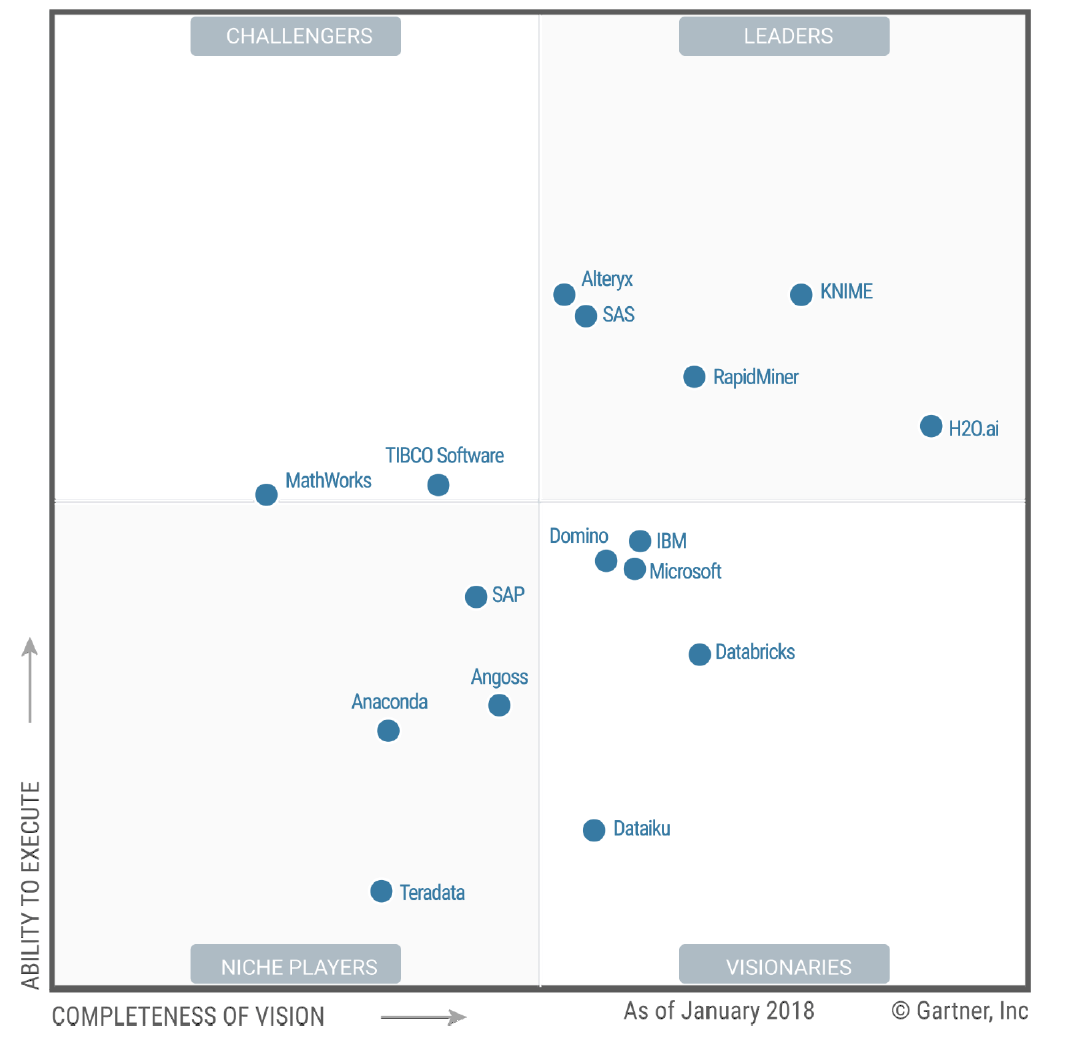
Figure 3b. Last year’s Gartner Magic Quadrant for Data Science and Machine Learning Platforms (January, 2018)
Those in the Challenger’s Quadrant have ample resources but less customer confidence in their future plans, or vision.
- Alteryx dropped slightly in vision from last year, just enough to drop it out of the Leaders quadrant. Its workflow-based user interface is very similar to that of KNIME and RapidMiner, and it too gets top marks in ease-of-use. It also offers very strong data management capabilities, especially those that involve geographic data, spatial modeling, and mapping. It comes with geo-coded datasets, saving its customers from having to buy it elsewhere and figuring out how to import it. However, it has fallen behind in cutting edge modeling methods such as deep learning, auto-modeling, and the Internet of Things.
- Dataiku strengthed its ability to execute significantly from last year. It added better scalability to its ease-of-use and teamwork collaboration. However, it is also perceived as expensive with a “cumbersome pricing structure.”
Members of the Niche Players quadrant offer tools that are not as broadly applicable. These include Anaconda, Datawatch (includes the former Angoss), Domino, and SAP.
- Anaconda provides a useful distribution of Python and various data science libraries. They provide support and model management tools. The vast army of Python developers is its strength, but lack of stability in such a rapidly improving world can be frustrating to production-oriented organizations. This is a tool exclusively for experts in both programming and data science.
- Datawatch offers the tools it acquired recently by purchasing Angoss, and its set of “Knowledge” tools continues to get high marks on ease-of-use and customer support. However, it’s weak in advanced methods and has yet to integrate the data management tools that Datawatch had before buying Angoss.
- Domino Data Labs offers tools aimed only at expert programmers and data scientists. It gets high marks for openness and ability to integrate open source and proprietary tools, but low marks for data access and prep, integrating models into day-to-day operations, and customer support.
- SAP’s machine learning tools integrate into its main SAP Enterprise Resource Planning system, but its fragmented toolset is weak, and its customer satisfaction ratings are low.
To see many other ways to rate this type of software, see my ongoing article, The Popularity of Data Science Software. You may also be interested in my in-depth reviews of point-and-click user interfaces to R. I invite you to subscribe to my blog or follow me on twitter where I announce new posts. Happy computing!
Want to share your content on python-bloggers? click here.