Exploratory and Predictive Data Analysis: Turning Passive Data into Actionable Insights
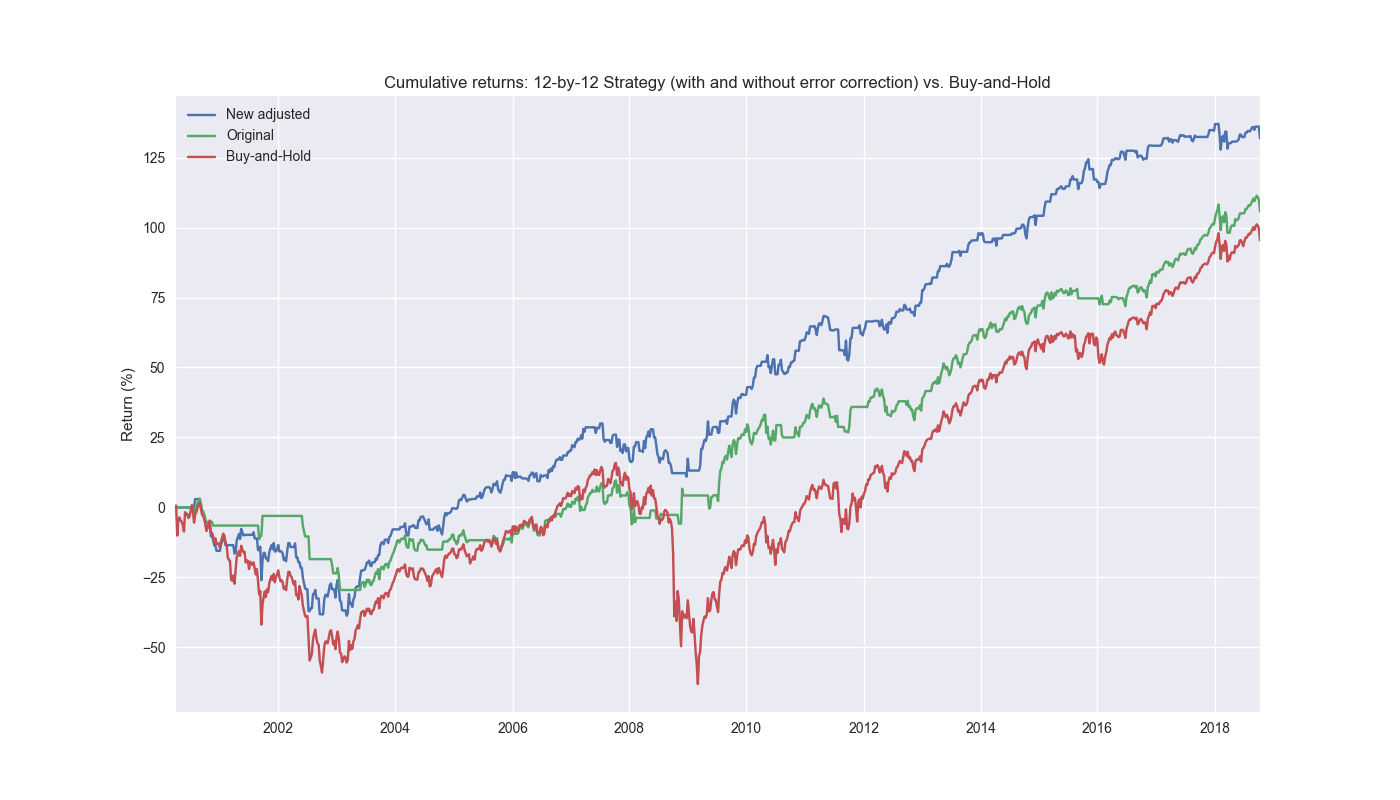
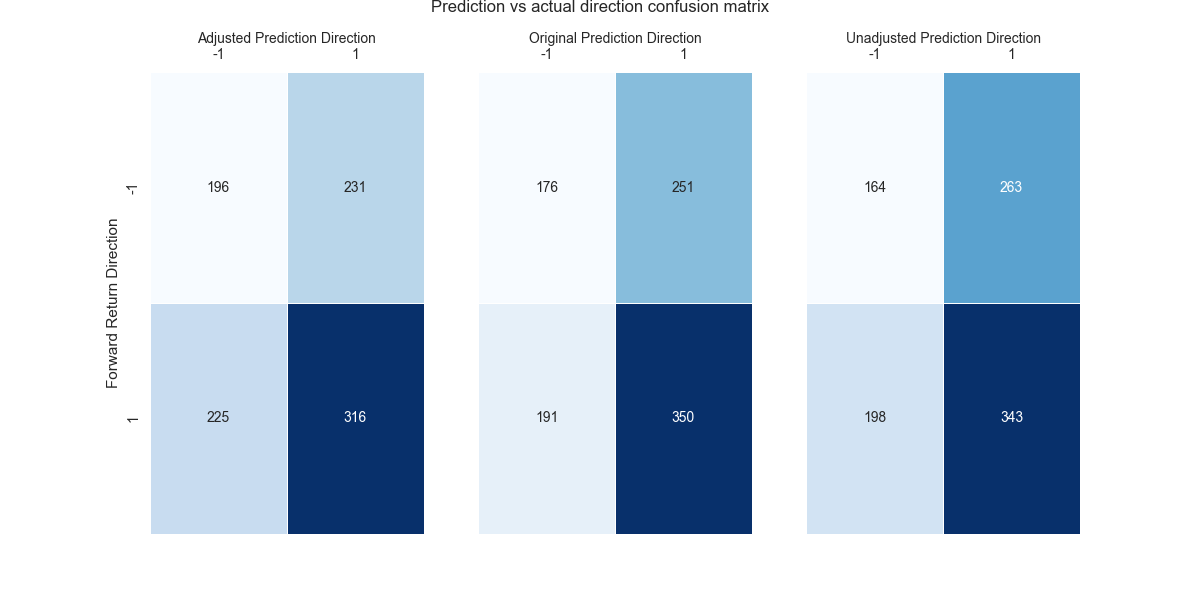
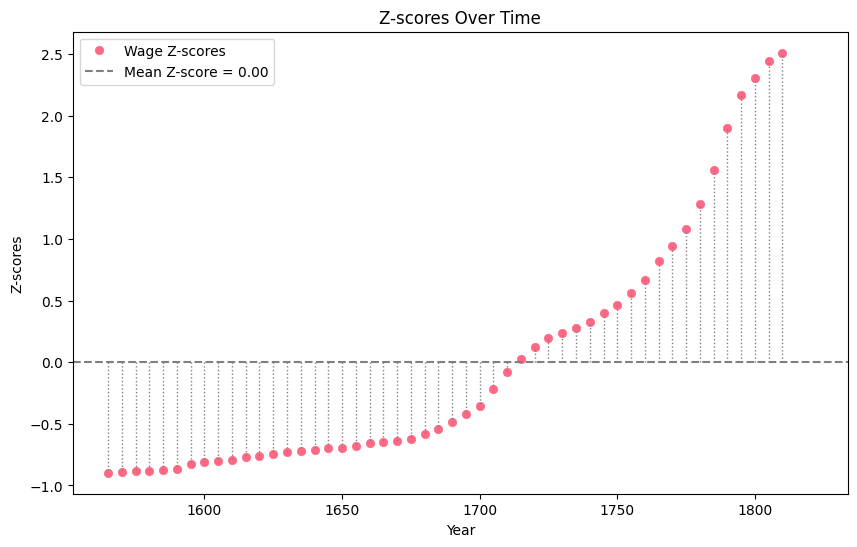
It’s not so much the amount of information that we are swamped with, but how we are unable to control and interpret it. Though we collect and generate data at never before rates, a lot of it sits idle, waiting to be explored and utilized. In this blog, we ...