Articles by OSM

Day 20: Strategy Sample

November 14, 2024 | OSM

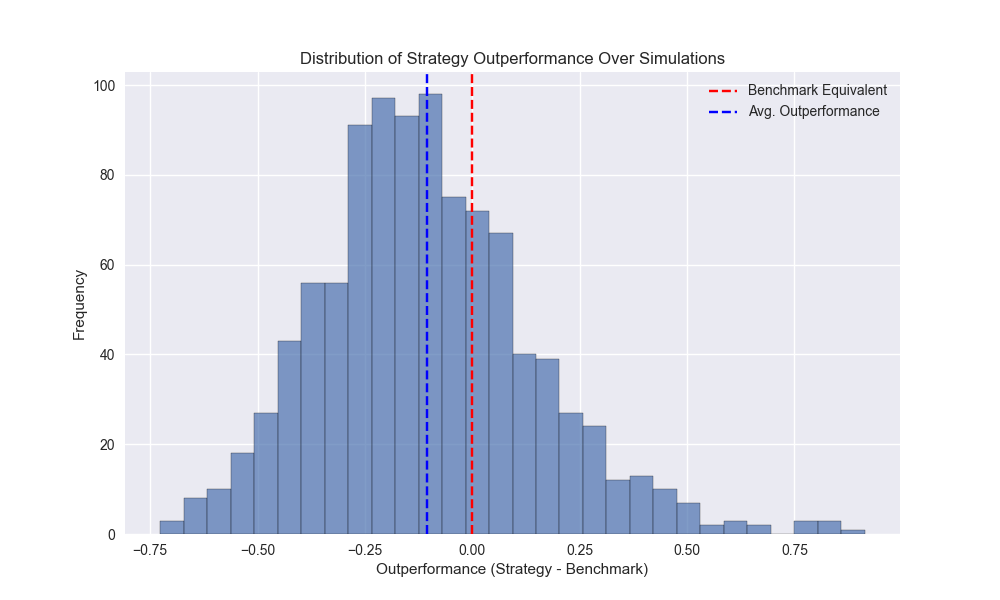
On Day 19, we introduced circular block sampling and used it to test the likelihood the 200-day SMA strategy would outperform buy-and-hold over a five year period. We found that the 200-day outperformed buy-and-hold a little over 25% of the time acr...
[...Read more...]

Day 19: Circular Sample

November 13, 2024 | OSM

On Day 18 we started to discuss simulating returns to quantify the probability of success for a strategy out-of-sample. The reason for this was we were unsure whether or how much to merit the 12-by-12’s performance relative to the 200-Day SMA. We di...
[...Read more...]

Day 18: Autocorrelation Again!

November 12, 2024 | OSM

On Day 17 , we compared the 12-by-12 and 200-day SMA strategies in terms of magnitude and duration of drawdowns, finding in favor of the 200-day. We also noted that most of the contributors to the differences in performance were due to two periods a...
[...Read more...]

Day 17: Drawdowns

November 11, 2024 | OSM

On Day 16, we showed the adjusted 12-by-12 strategy with full performance metrics against buy-and-hold, the 60-40 SPY-IEF ETF portfolio, and the 200-day SMA strategy. In all cases, it tended to perform better than the benchmarks. However, against th...
[...Read more...]

Day 16: Comps

November 8, 2024 | OSM

On Day 15 we adjusted our model to use more recent data to forecast the 12-week look forward return. As before, we used that forecast to generate a trading signal that tells us to go long the SPY if the forecast is positive, and exit (or short for t...
[...Read more...]

Day 15: Backtest II

November 7, 2024 | OSM

On Day 14 we showed how the trading model we built was snooping and provided one way to correct it. Essentially, we ensure the time in which we actually have the target variable data aligns with when the trading signals are produced. We then used th...
[...Read more...]

Day 14: Snooping

November 6, 2024 | OSM

Guess what? The model we built in our last post actually suffers from snooping. We did this deliberately to show how easy it is to get mixed up when translating forecasting models into trading signals. Let’s explain. Our momentum model uses a 12-wee...
[...Read more...]

Day 13: Backtest I

November 5, 2024 | OSM

Unlucky 13! Or contrarian indicator? There’s really nothing so heartwarming as magical thinking. Whatever the case, on Day 12 we iterated through the 320 different model and train step iterations to settle on 10 potential candidates. Today, we look ...
[...Read more...]

One-N against the world!

November 2, 2021 | OSM

We’re taking a short break from neural networks to return to portfolio optimization. Our last posts in the portfolio series discussed risk-constrained optimization. Before that we examined satisificing vs. mean-variance optimization (MVO). In our last post on that topic, we simulated 1,000 60-month (5-year) return series using the 1987-1991 period ...
[...Read more...]

Netting income

September 15, 2021 | OSM

For fundamental equity investors, the financial statement is the launchpad for the search for value. True, quants use financial statements too. But they spend less time on what the numbers mean, than on what they are. To produce a financial statement that adequately captures the economic (not GAAP or IFRS) ...
[...Read more...]
1 2 3 4 15