We’re returning to our portfolio discussion after detours into topics on the put-write index and non-linear correlations. We’ll be investigating alternative methods to analyze, quantify, and mitigate risk, including risk-constrained optimization, a topic that figures large in factor research.
The main idea is that there are certain risks ...
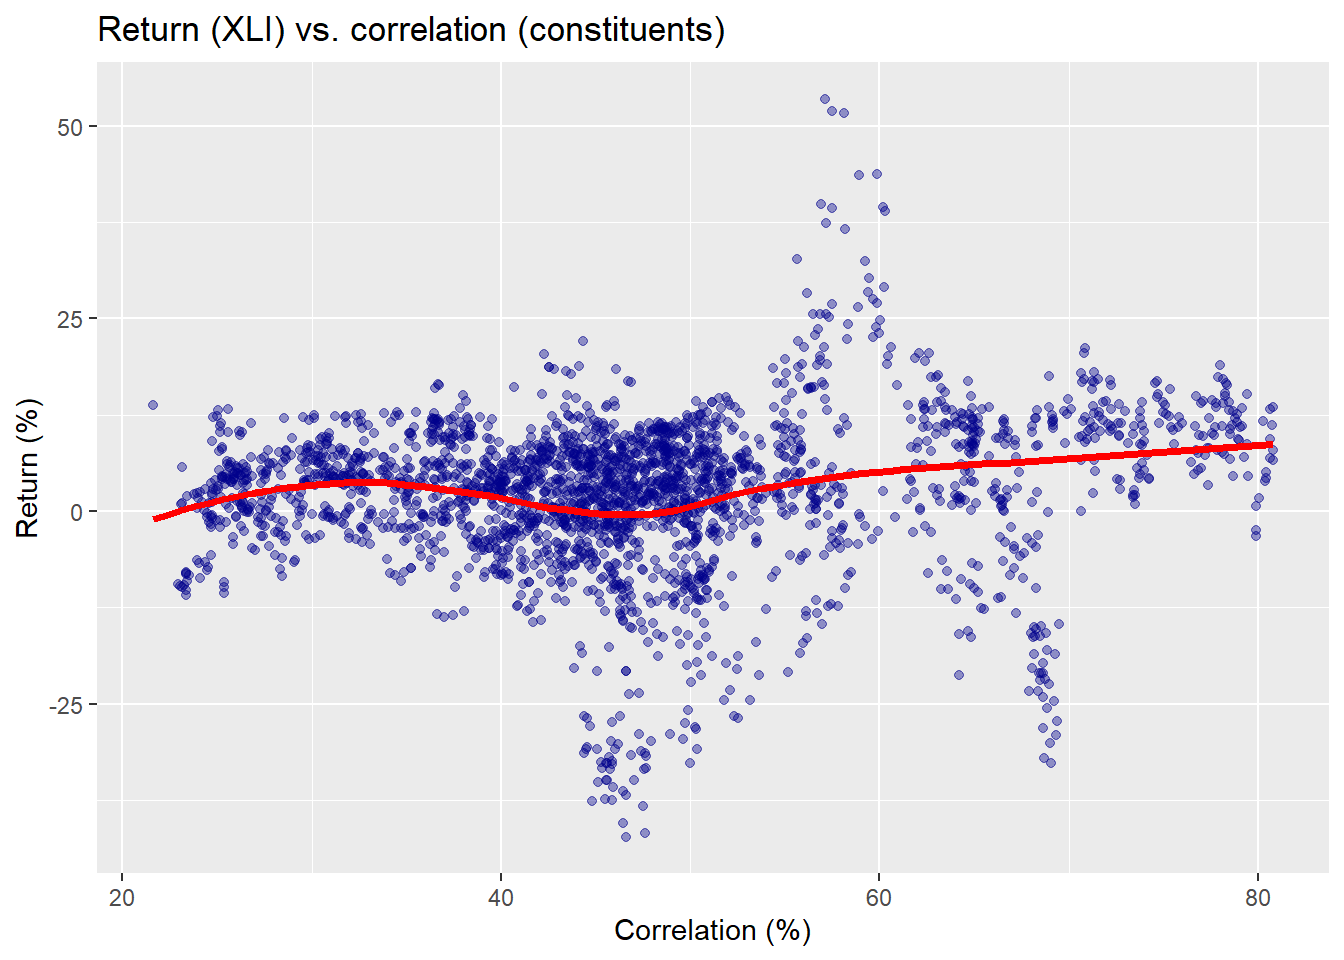
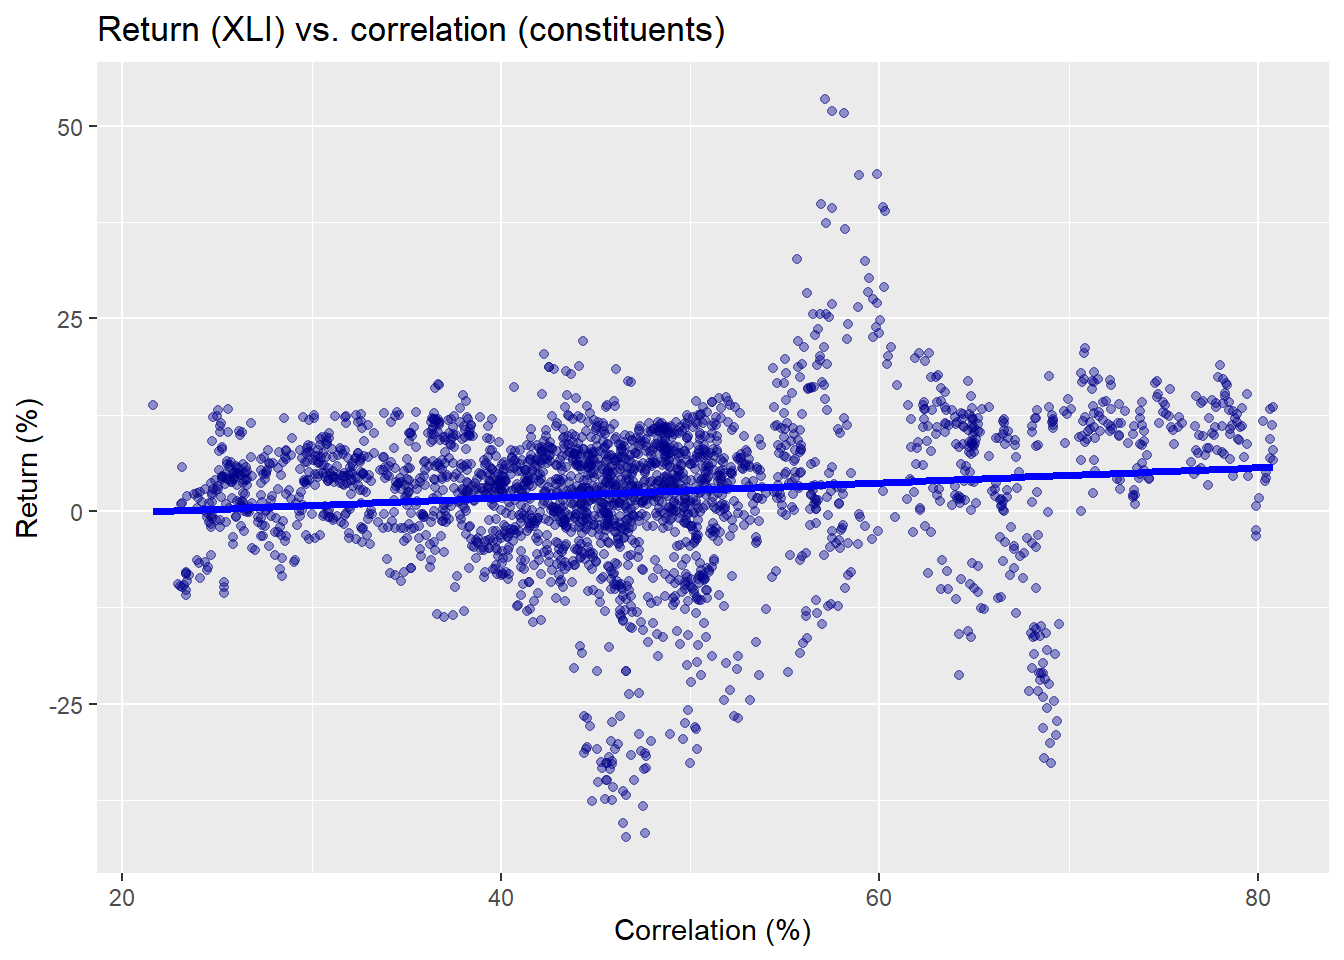
In our last post, we took our analysis of rolling average pairwise correlations on the constituents of the XLI ETF one step further by applying kernel regressions to the data and comparing those results with linear regressions. Using a cross-validat...
In our last post, we took our analysis of rolling average pairwise correlations on the constituents of the XLI ETF one step further by applying kernel regressions to the data and comparing those results with linear regressions. Using a cross-validat...
In our last post, we took our analysis of rolling average pairwise correlations on the constituents of the XLI ETF one step further by applying kernel regressions to the data and comparing those results with linear regressions. Using a cross-validat...
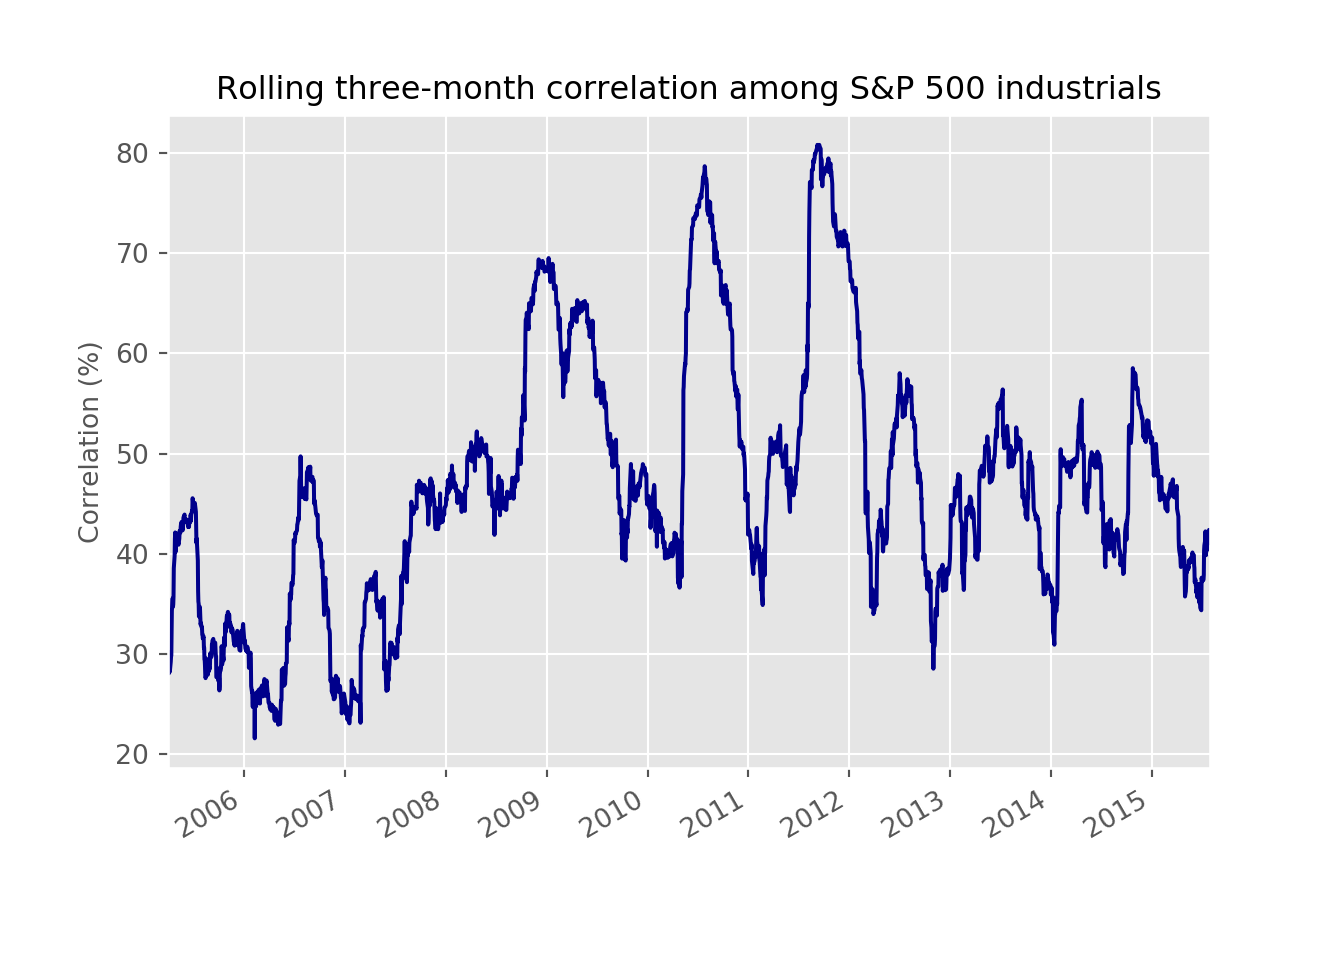
In our last post, we looked at a rolling average of pairwise correlations for the constituents of XLI, an ETF that tracks the industrials sector of the S&P 500. We found that spikes in the three-month average coincided with declines in the under...
In our last post, we looked at a rolling average of pairwise correlations for the constituents of XLI, an ETF that tracks the industrials sector of the S&P 500. We found that spikes in the three-month average coincided with declines in the under...
In our last post, we looked at a rolling average of pairwise correlations for the constituents of XLI, an ETF that tracks the industrials sector of the S&P 500. We found that spikes in the three-month average coincided with declines in the under...
We recently read two blog posts from Robot Wealth and FOSS Trading on calculating rolling pairwise correlations for the constituents of an S&P 500 sector index. Both posts were very interesting and offered informative ways to solve the problem using different packages in R: tidyverse or xts. We’ll use ...