How to Interpret High P-Value and Low Chi-Squared in Stata
Want to share your content on python-bloggers? click here.
Statistical analysis plays a crucial role in research and decision-making. When using Stata, a powerful statistical software, researchers often encounter situations with high p-values and low chi-squared values. Understanding how to interpret these results is essential for drawing accurate conclusions from data.
This article delves into the interpretation of high p-values and low chi-squared values in Stata. It explores the concepts of statistical significance, null hypotheses, and proportions. The guide also compares t-tests and chi-square tests, shedding light on their applications in various fields, including psychology. By the end, readers will gain insights into what Stata is and how to use it for effective statistical analysis.
Understanding P-Values and Chi-Squared in Stata

What is a p-value?
In statistical analysis, a p-value is a crucial concept that helps researchers determine the significance of their findings. It represents the probability of obtaining results as extreme as the observed data, assuming the null hypothesis is true. In Stata, p-values play a vital role in hypothesis testing and decision-making processes.
When working with Stata, researchers often encounter p-values in various statistical tests. For instance, when performing a chi-square test, Stata provides a p-value alongside the test statistic. This value helps interpret the results and draw conclusions about the relationship between variables.
A smaller p-value indicates stronger evidence against the null hypothesis. Typically, a p-value less than 0.05 is considered statistically significant, leading researchers to reject the null hypothesis. However, it’s important to note that the significance threshold may vary depending on the field of study and the specific research context.
What is a chi-squared statistic?
The chi-squared statistic is a fundamental tool in statistical analysis, particularly useful for examining relationships between categorical variables. In Stata, the chi-squared test is commonly used to assess the independence or association between two variables.
When performing a chi-squared test in Stata, the software calculates the chi-squared statistic based on the observed and expected frequencies in a contingency table. The formula for the chi-squared statistic involves summing the squared differences between observed and expected frequencies, divided by the expected frequencies.
Stata offers various options to display additional statistics and cell contents when conducting a chi-squared test. For example, researchers can use the “cchi2” option to include chi-squared values within the output table, providing a more detailed view of the results.
Relationship between p-value and chi-squared
The relationship between p-value and chi-squared is fundamental to understanding statistical significance in Stata. When conducting a chi-squared test, Stata calculates both the chi-squared statistic and the corresponding p-value.
The p-value is derived from the chi-squared distribution, taking into account the degrees of freedom in the analysis. In Stata, the degrees of freedom for a chi-squared test are typically calculated as (number of rows – 1) × (number of columns – 1) in a contingency table.
To interpret the results, researchers examine both the chi-squared statistic and the p-value. A large chi-squared value, combined with a small p-value, suggests a significant relationship between the variables being analyzed. Conversely, a small chi-squared value and a large p-value indicate weak or no evidence of association.
It’s worth noting that Stata provides additional measures of association alongside the chi-squared test. These include Cramér’s V, Goodman and Kruskal’s gamma, and Kendall’s tau-b, which can offer further insights into the strength and nature of relationships between variables.
When interpreting high p-values and low chi-squared values in Stata, researchers should consider the context of their study and the specific research questions being addressed. While these results might suggest a lack of significant association, they should be evaluated in conjunction with other factors, such as sample size and effect size, to draw comprehensive conclusions.
In conclusion, understanding p-values and chi-squared statistics in Stata is essential for conducting robust statistical analyzes. By leveraging these concepts effectively, researchers can make informed decisions and draw meaningful insights from their data, ultimately contributing to more reliable and impactful research outcomes.
Interpreting High P-Values in Stata

What constitutes a high p-value
In statistical analysis using Stata, understanding what constitutes a high p-value is crucial for interpreting research results. Generally, a p-value greater than 0.05 is considered high in many fields of study. This threshold, however, is not set in stone and can vary depending on the research context and discipline.
A high p-value indicates that the observed data are not unusual under the null hypothesis. For instance, if a study yields a p-value of 0.14, it suggests that there is a 14% chance of obtaining results as extreme as or more extreme than those observed, assuming the null hypothesis is true. This does not necessarily mean that there is no effect or difference; rather, it implies that the evidence against the null hypothesis is not strong enough to reject it based on the conventional significance level.
Implications of a high p-value
When researchers encounter a high p-value in Stata, it has several implications for their study. Firstly, a high p-value does not prove that the null hypothesis is true or should be accepted. It merely indicates that the data do not provide sufficient evidence to reject the null hypothesis. This distinction is crucial, as failing to reject the null hypothesis is not equivalent to proving its truth.
Secondly, a high p-value suggests that the observed difference or effect might be due to chance rather than a true underlying relationship. However, this does not rule out the possibility of a real effect. The study may have lacked sufficient statistical power to detect a significant difference, especially if the sample size was small or the effect size was modest.
Furthermore, a high p-value does not necessarily indicate that the effect size is small. In some cases, even large effects may fail to reach statistical significance, particularly in studies with limited sample sizes. Therefore, it is essential to consider both the p-value and the effect size when interpreting results in Stata.
Common misconceptions about high p-values
Several misconceptions surround the interpretation of high p-values in statistical analysis using Stata. One common misunderstanding is that a high p-value proves the absence of an effect or demonstrates that no difference exists between groups. This is incorrect, as a high p-value only suggests that the data are not unusual under the null hypothesis.
Another misconception is that a high p-value indicates that the test hypothesis is true or should be accepted. In reality, a large p-value only suggests that the data are not unusual if all the assumptions used to compute the p-value, including the test hypothesis, were correct. It does not provide direct evidence in favor of the test hypothesis.
Researchers often mistakenly believe that a high p-value means their study found “no association” or “no evidence” of an effect. However, unless the point estimate exactly equals the null value, some association must be present in the data. It is crucial to examine the confidence intervals and effect sizes to gain a more comprehensive understanding of the results.
Lastly, it is a common error to equate statistical significance with scientific or substantive importance. A high p-value does not necessarily imply that the effect is trivial or unimportant. Conversely, a low p-value does not automatically indicate a meaningful effect, especially in large studies where even minor effects can achieve statistical significance.
In conclusion, interpreting high p-values in Stata requires a nuanced understanding of statistical concepts and careful consideration of various factors, including sample size, effect size, and confidence intervals. By avoiding common misconceptions and considering the broader context of their research, scientists can make more informed decisions based on their statistical analyzes.
Analyzing Low Chi-Squared Values in Stata

What is considered a low chi-squared value
In statistical analysis using Stata, understanding what constitutes a low chi-squared value is crucial for interpreting research results. Generally, a chi-squared value is considered low when it is close to zero or significantly smaller than the degrees of freedom. This indicates that the observed data closely match the expected frequencies under the null hypothesis.
When conducting a chi-squared test in Stata, the software calculates the chi-squared statistic based on the observed and expected frequencies in a contingency table. A low chi-squared value suggests that there is little discrepancy between the observed and expected frequencies, which may lead to a high p-value.
Meaning of a low chi-squared statistic
A low chi-squared statistic in Stata has important implications for the interpretation of research findings. It suggests that the observed data are consistent with the null hypothesis, indicating that there may not be a significant relationship between the variables being analyzed.
When researchers encounter a low chi-squared value, it often results in a high p-value. For example, if a study yields a p-value greater than the conventional significance level of 0.05, it suggests that there is insufficient evidence to reject the null hypothesis. This does not necessarily mean that there is no effect or difference; rather, it implies that the evidence against the null hypothesis is not strong enough based on the data at hand.
It’s important to note that a low chi-squared value and a high p-value do not prove that the null hypothesis is true or should be accepted. They merely indicate that the data do not provide sufficient evidence to reject the null hypothesis. This distinction is crucial, as failing to reject the null hypothesis is not equivalent to proving its truth.
Potential reasons for low chi-squared values
Several factors can contribute to low chi-squared values in Stata analyzes:
- Small sample size: When the sample size is small, the chi-squared test may lack statistical power to detect significant differences, even if they exist in the population. This can result in low chi-squared values and high p-values.
- Weak effect size: If the relationship between variables is weak or the differences between groups are small, it may lead to a low chi-squared value. In such cases, even large sample sizes might not yield statistically significant results.
- Inappropriate categorization: When continuous or ordinal data are unnecessarily converted to categorical data to use the chi-square test, it can result in loss of information and potentially lead to low chi-squared values.
- Violation of test assumptions: Chi-squared tests have certain assumptions, such as independence of observations and minimum expected cell frequencies. Violating these assumptions can affect the validity of the results and potentially lead to low chi-squared values.
- Overestimation of error variance: In some cases, a low chi-squared value (χ²ν < 1) may indicate that the model is “overfitting” the data, suggesting that either the model is improperly fitting noise or the error variance has been overestimated.
It’s worth noting that researchers should be cautious when interpreting low chi-squared values and high p-values. These results do not necessarily mean that there is no association or effect. They may simply indicate that the study lacked sufficient statistical power to detect a significant difference, especially if the sample size was small or the effect size was modest.
To gain a more comprehensive understanding of the results, researchers should consider examining confidence intervals and effect sizes alongside the chi-squared statistic and p-value. Additionally, conducting power analyzes can help determine whether the study had adequate statistical power to detect meaningful effects.
In conclusion, analyzing low chi-squared values in Stata requires a nuanced understanding of statistical concepts and careful consideration of various factors. By avoiding common misconceptions and considering the broader context of their research, scientists can make more informed decisions based on their statistical analyzes.
Conclusion
The interpretation of high p-values and low chi-squared statistics in Stata has a significant impact on research conclusions. Understanding these concepts helps researchers to make sense of their findings and avoid common pitfalls in statistical analysis. This article has shed light on the meaning behind these values, their implications, and potential reasons for their occurrence.
To wrap up, it’s crucial to remember that statistical significance doesn’t always equate to practical importance. Researchers should look at the bigger picture, considering factors like sample size, effect size, and confidence intervals alongside p-values and chi-squared statistics. By taking a well-rounded approach to data analysis, scientists can draw more meaningful insights from their studies and contribute to advancing knowledge in their fields.
FAQs
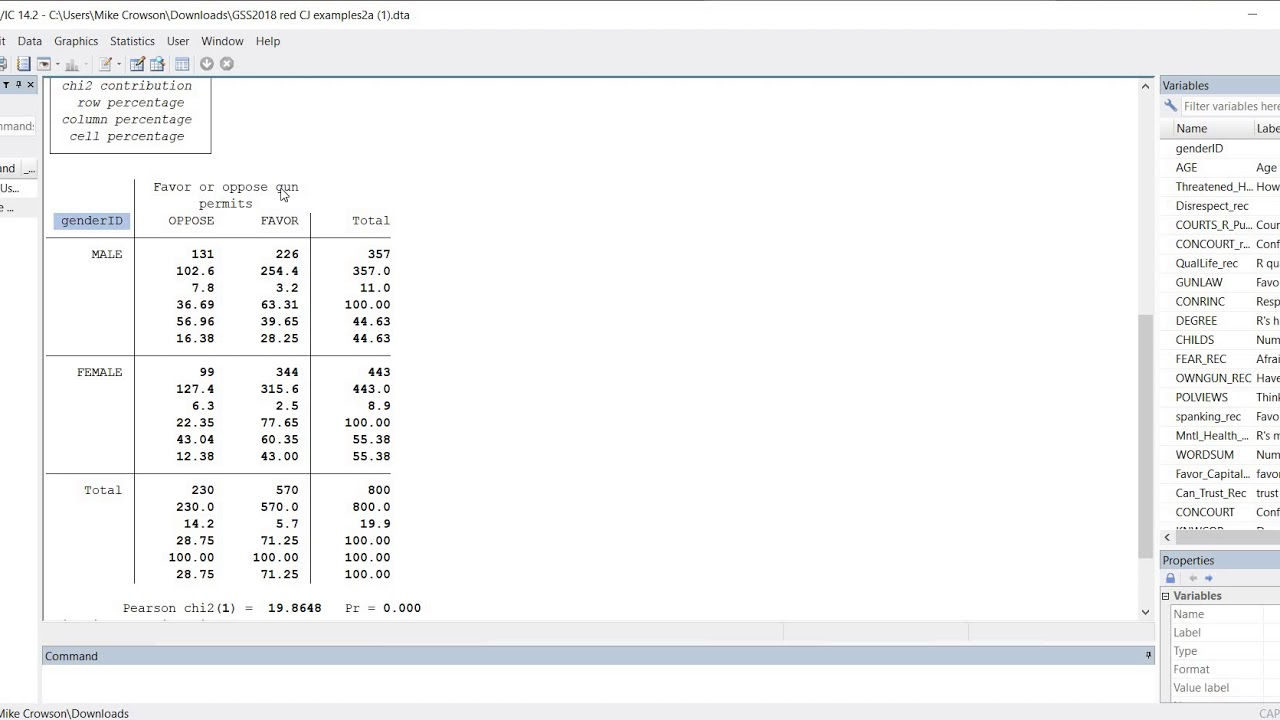
- How do you interpret the chi-square value and p-value in Stata?
In Stata, when analyzing a cross table between two variables, the output includes the chi-square value (Pearson chi2) and a p-value (Pr). If the p-value is below 0.05, it suggests that the two variables are not independent, indicating a statistically significant relationship. - What does the chi-square value and its corresponding p-value signify in statistical analysis?
In statistical terms, the p-value in a chi-square test represents the probability of observing a chi-square statistic as large as, or larger than, the value obtained in your data, assuming the null hypothesis is true. It essentially measures the likelihood that any observed differences are due to chance. - How should one interpret a p-value in Stata?
Stata automatically adjusts for the number of degrees of freedom in its calculations. A p-value less than 0.05 indicates significance at the 95% confidence level, suggesting strong evidence against the null hypothesis. Conversely, a p-value less than 0.01 indicates significance at the 99% confidence level, providing even stronger evidence against the null hypothesis. - What does it mean if the p-value exceeds 0.05 in a chi-square test?
A p-value greater than 0.05 in a chi-square test implies that there is insufficient evidence to reject the null hypothesis. This means we do not have enough statistical evidence to assert that a significant difference or relationship exists.
Want to share your content on python-bloggers? click here.