Multiple Linear Regression using Tensorflow
Want to share your content on python-bloggers? click here.
This post implements the standard matrix based estimation of multiple linear regression model using Tensorflow. With this example, we can learn some basic vector or matrix operations in Tensorflow and also Python.
Linear Regression using Tensorflow
To study some basic vector or matrix operations in Tensorflow which is not familiar to us, we take the linear regression model as an example, which is familiar to us.
Linear Regression model
Multiple linear regression model has the following expression. \((t=1,2,…,n)\)
\[\begin{align} Y_t&=\beta_0+\beta_1 X_{1t}+\beta_2 X_{2t}+⋯+\beta_{p-1} X_{p-1,t}+\epsilon_t \end{align}\]
Here \(Y_t\) is the dependent variable and \( X_t = (1,X_{1t},X_{2t},…,X_{p-1,t})\) is a set of independent variables. \(\beta=(\beta_0,\beta_1,\beta_2,…,\beta_{p-1} )^{‘}\) is a vector of parameters and \(\epsilon_t\) is a vector or stochastic disturbances.
It is worth noting that the number of parameters is \(p\) and the number of variables is \(p-1\)
Stochastic error term \(\epsilon_t\) is assumed in the following way.
- \(E[\epsilon_t ]=0\), \(\text{var}[\epsilon_t ]=\sigma_\epsilon^2\)
- For all \(t_1\) and \(t_2\), \((t_1≠t_2)\), \(cov[\epsilon_{t1}, \epsilon_{t2}]=E[\epsilon_{1t} \epsilon_{2t} ]=0\)
- \(\epsilon_t\) follows a normal distribution
Least Squares Estimator
To estimate the regression coefficients \(\beta\), we use least squares which minimize the sum of squared residuals. In a matrix notation, the least squares estimator is calculated in the following way. \[\begin{align} S(\beta)&=\sum_{t=1}^{n}\epsilon_t^2=\epsilon^{‘} \epsilon \\ &=(Y-X\beta)^{‘} (Y-X\beta) \\ &=(Y^{‘}-\beta^{‘} X^{‘} )(Y-X\beta) \\ &=Y^{‘} Y-Y^{‘} X\beta-\beta^{‘} X^{‘} Y+\beta^{‘} X^{‘} X\beta \\ &=Y^{‘} Y-2\beta^{‘} X^{‘} Y+\beta^{‘} X^{‘} X\beta \\ \end{align}\]
Differentiating \(S(\beta)\) with respect to \(\beta\) and set to zero results in the following the normal equation. \[ \frac{\partial S(\beta)}{\partial \beta} = -2X^{‘} Y+2X^{‘} X \beta=0 \] Hence the least squares estimator of \(\beta\) is \[ \hat{\beta}=(X^{‘} X)^{-1} X^{‘} Y \]
Standard Errors
\(\hat{\beta}\) follows the following distribution
\[\begin{align} \hat{\beta} \sim N \left(\beta, \sigma_{\epsilon}^2 (X^{‘} X)^{-1} \right) \end{align}\] \[\begin{align} \text{cov}[\hat{\beta}] &= \text{cov}[ (X^{‘} X)^{-1} X^{‘} Y ] \\ &= (X^{‘} X)^{-1} X^{‘} \text{cov}[Y] X(X^{‘} X)^{-1} \\ &= (X^{‘} X)^{-1} X^{‘} \sigma_{\epsilon}^2 I X(X^{‘} X)^{-1} \\ &= \sigma_{\epsilon}^2 (X^{‘} X)^{-1} X^{‘} I X(X^{‘} X)^{-1} \\ &= \sigma_{\epsilon}^2 (X^{‘} X)^{-1} \end{align}\] Since \(\sigma_{\epsilon}^2\) is the population parameter we don’t know, \(\sigma_{\epsilon}^2\) is replaced with \(s^2\), the sample estimate of \(\sigma^2\). \[\begin{align} \widehat{\text{cov}[\hat{\beta}]} &= s^2 (X^{‘} X)^{-1} \\ \\ s^2 &= \frac{e^{‘}e}{n-\color{red}{p}} \end{align}\] To estimate \(\sigma^2\), we need to estimate \(p\) parameters (1 intercept + (p-1) coefficients),in other words, \(p\) degree of freedom is lost.
Python code using Tensorflow
The purpose of this post is to learn some basic vector or matrix operations (matrix multiplication, transpose, inverse, etc.) in Tensorflow. As an example, we use the diabetes data from sklearn package which has 10 explanatory variables and 1 response variable.
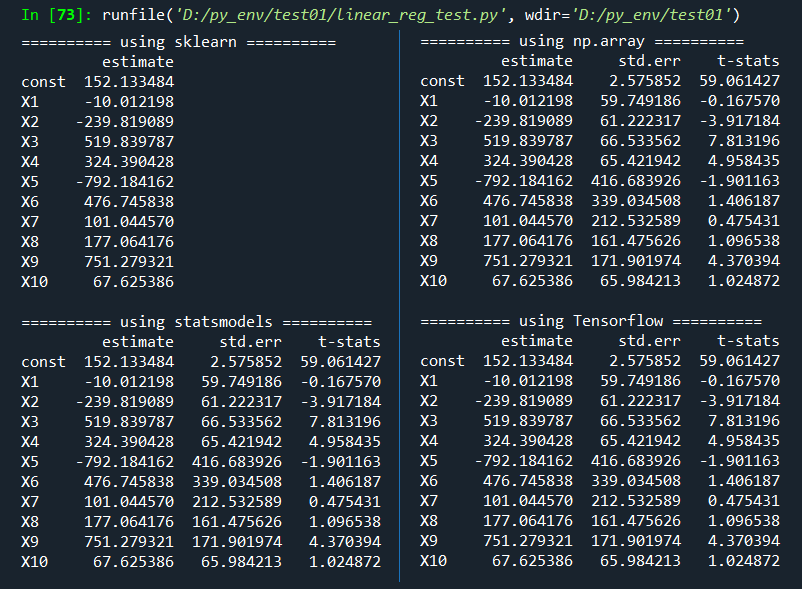
To check the estimation accuracy, regression outputs from sklearn, statsmodels are also considered. pd.DataFrame() from pandas package is used for make a table from np.array or Tenslorflow objects.
# -*- coding: utf-8 -*- “”“ #========================================================# # Quantitative ALM, Financial Econometrics & Derivatives # ML/DL using R, Python, Tensorflow by Sang-Heon Lee # # https://kiandlee.blogspot.com #——————————————————–# # Linear Regression model using Tensorflow #========================================================# ““” import pandas as pd import numpy as np from sklearn import datasets, linear_model “”“”“”“”“”“”“”“”“”“”“”“”“”“”“”“”“”“”“”“”“”“”“”“”“”“ Load the diabetes dataset ““”“”“”“”“”“”“”“”“”“”“”“”“”“”“”“”“”“”“”“”“”“”“”“”“” X, y = datasets.load_diabetes(return_X_y=True) nrow, ncol = X.shape; print (nrow, ncol) nparam = ncol+1 # number of parameters v_row_name = np.hstack( [[“const”], [“X”+str(i) for i in range(1,ncol+1)]]) “”“”“”“”“”“”“”“”“”“”“”“”“”“”“”“”“”“”“”“”“”“”“”“”“”“ 1) using sklearn ““”“”“”“”“”“”“”“”“”“”“”“”“”“”“”“”“”“”“”“”“”“”“”“”“” reg_mod = linear_model.LinearRegression() # object reg_mod.fit(X, y) # estimation or tradining df_out_sk = pd.DataFrame( np.hstack([reg_mod.intercept_, reg_mod.coef_])) df_out_sk.columns = [“estimate”] df_out_sk.index = v_row_name print(“\n========== using sklearn ==========”) print(df_out_sk) “”“”“”“”“”“”“”“”“”“”“”“”“”“”“”“”“”“”“”“”“”“”“”“”“”“ 2) using statsmodels ““”“”“”“”“”“”“”“”“”“”“”“”“”“”“”“”“”“”“”“”“”“”“”“”“” import statsmodels.api as sm Xw1 = sm.add_constant(X) ols = sm.OLS(y, Xw1) fit = ols.fit() #print(fit.summary()) df_out_ss = pd.DataFrame(np.vstack([fit.params, fit.bse, fit.params/fit.bse]).T) df_out_ss.columns = [“estimate”, “std.err”, “t-stats”] df_out_ss.index = v_row_name print(“\n========== using statsmodels ==========”) print(df_out_ss) “”“”“”“”“”“”“”“”“”“”“”“”“”“”“”“”“”“”“”“”“”“”“”“”“”“ 3) using matrix formula (np.array) ““”“”“”“”“”“”“”“”“”“”“”“”“”“”“”“”“”“”“”“”“”“”“”“”“” mX = np.column_stack([np.ones(nrow),X]) beta = np.linalg.inv(mX.T.dot(mX)).dot(mX.T).dot(y) err = y – mX.dot(beta) s2 = err.T.dot(err)/(nrow–ncol–1) cov_beta = s2*np.linalg.inv(mX.T.dot(mX)) std_err = np.sqrt(np.diag(cov_beta)) df_out_np = pd.DataFrame( np.row_stack((beta, std_err, beta/std_err)).T) df_out_np.columns = [“estimate”, “std.err”, “t-stats”] df_out_np.index = v_row_name print(“\n========== using np.array ==========”) print(df_out_np) “”“ #================================================== # 4) using matrix formula (Tensorflow) #================================================== ““” import tensorflow as tf # from np.array y = tf.constant(y, shape=[nrow, 1]) X = tf.constant(X, shape=[nrow, ncol]) # need double tensor one = tf.cast(tf.ones([nrow, 1]), tf.float64) oneX = tf.concat([one, X], 1); # 1, X XtX = tf.matmul(oneX, oneX ,transpose_a=True) Xty = tf.matmul(oneX, y ,transpose_a=True) beta = tf.matmul(tf.linalg.inv(XtX),Xty) err = y – tf.matmul(oneX, beta) s2 = tf.matmul(err, err, transpose_a=True)/(nrow–nparam) cov_beta = s2*tf.linalg.inv(XtX) std_err = tf.sqrt(tf.linalg.diag_part(cov_beta)) beta = tf.reshape(beta,[nparam]) est_out = tf.stack([beta, std_err, beta/std_err],1) df_out_tf = pd.DataFrame(np.asarray(est_out)) df_out_tf.columns = [“estimate”, “std.err”, “t-stats”] df_out_tf.index = v_row_name print(“\n========== using Tensorflow ==========”) print(df_out_tf) | cs |
We can easily find that all results are the same as expected. In particular, two approaches using np.array and Tensorflow has the nearly same structure.
Concluding Remarks
This post dealt with how to use some basic vector or matrix operations of Tensorflow. It is similar to that of np.arrary but there are some subtle differences about manipulating array objects. Based on these, if we know remaining subjects such as for-loop, function definition, and optimization, it is expected that we can implement state space model using Kalman filter and estimate its parameters. \(\blacksquare\)
Want to share your content on python-bloggers? click here.
