MySQL EXPLAIN and EXPLAIN ANALYZE
Want to share your content on python-bloggers? click here.
In this article we look at how to use the MySQL EXPLAIN and EXPLAIN ANALYZE commands to optimise your queries.
We review the syntax these commands use, interpreting their output and how tools like MySQL Workbench and dbForge Studio for MySQL be used in conjunction with them.
To do this we’ll work through some very simple examples using the Sakila sample database so that you can see these commands in use.
Understanding EXPLAIN in MySQL
Introduction
The EXPLAIN command is a key tool for MySQL query optimisation. It provides a detailed analysis of how a query will be executed step-by-step.
This makes it easy to spot where large amounts of unnecessary resources (for example, full table scans) are being used showing you where you need to edit your query or set up.
Let’s look at a simple example:
| EXPLAIN SELECT f.title, r.rental_date, c.first_name, c.last_name FROM sakila.film f JOIN sakila.inventory i ON f.film_id = i.film_id JOIN sakila.rental r ON i.inventory_id = r.inventory_id JOIN sakila.customer c ON r.customer_id = c.customer_id WHERE f.rating = ‘PG’ AND r.return_date IS NULL; |
Here is the output:

Components of EXPLAIN Output
The output of the EXPLAIN command is a table which gives details of the query execution plan.
- id: This identifies the SELECT query this row refers to. In our example, all parts of the query have an id of 1, which tells us the query only contains one SELECT statement.
- select_type: This identifies the type of SELECT query this row refers to. All of our rows show SIMPLE, which means that it is a straightforward SELECT without any sub-queries or unions.
- table: This refers to the name of the table that this row refers to. In our example it is showing ‘f’ (film), ‘i’ (inventory), ‘r’ (rental), and ‘c’ (customer) which are tables contained in the Sakila database.
- type: This details they type of join used. Possible values include ALL (full table scan), index (index scan), range (range scan on indexed column), ref (non-unique index lookup), eq_ref (unique index lookup), const (single row lookup), and NULL (no access required). For example, the rental (r) type is ref, indicating a non-unique index lookup using idx_fk_inventory_id.
- possible_keys: This contains the indexes MySQL could use to find rows in the table. It helps you to understand which indexes MySQL will consider. For example, the possible keys for rental (r) are idx_fk_inventory_id and idx_fk_customer_id.
- key: This contains the actual index used to execute the query. In our example query, the index used for rental (r) is idx_fk_inventory_id.
- key_len: The length of the key used. This is the number of bytes of data that MySQL uses from the index. So looking at our example, for inventory (i), it is 2 bytes.
- ref: This is the columns or constants used to select rows from the table. So looking at inventory (i) again, it is referencing sakila.f.film_id.
- rows: This tells you the estimated number of rows that MySQL will use to execute the query, so it provides an estimate of how many rows match the conditions. For example, for film (f), it is 1000 rows.
- filtered: This column contains
- extra: This column is used for other additional information about the query execution. For example, whether a temporary table or file sort is used. Common values include ‘Using where’ (indicating a WHERE clause is used to filter rows) and ‘Using index’ (indicating the query uses a covering index). For example, rental (r) shows ‘Using where’.
Understanding this takes the guess work out of optimisation making it far faster.
What is EXPLAIN ANALYZE in MySQL?
EXPLAIN ANALYZE was introduced in Q4 2019 as an improvement to EXPLAIN. It gives more actionable information by providing actual (as opposed to theoretical) performance metrics.
EXPLAIN ANALYZE actually executes the query and provides the real execution plan and detailed statistics.
Why Use EXPLAIN ANALYZE?
EXPLAIN ANALYZE offers a number of benefits:
- Real-Time Performance Metrics: By providing the actual execution times and the number of rows processed using it makes sure that you are focused on the most resource-intensive parts of your query.
- Accurate Diagnosis of Performance Issues: Helps identify performance bottlenecks by showing where the query spends the most time.
- Comparison with EXPLAIN: It shows where there are discrepancies between the estimated and actual performance, which gives users a better understanding of how to use the query optimiser.
- Detailed Execution Plan: It gives insights into memory usage, disk I/O, and other performance factors and so goes beyond what is offered by EXPLAIN.
Using EXPLAIN ANALYZE
Basic Syntax and Usage
You use EXPLAIN ANALYZE in exactly the same way as you use EXPLAIN. You simply add it before your query, as shown below.
Let’s execute it using the same query as we did previously.
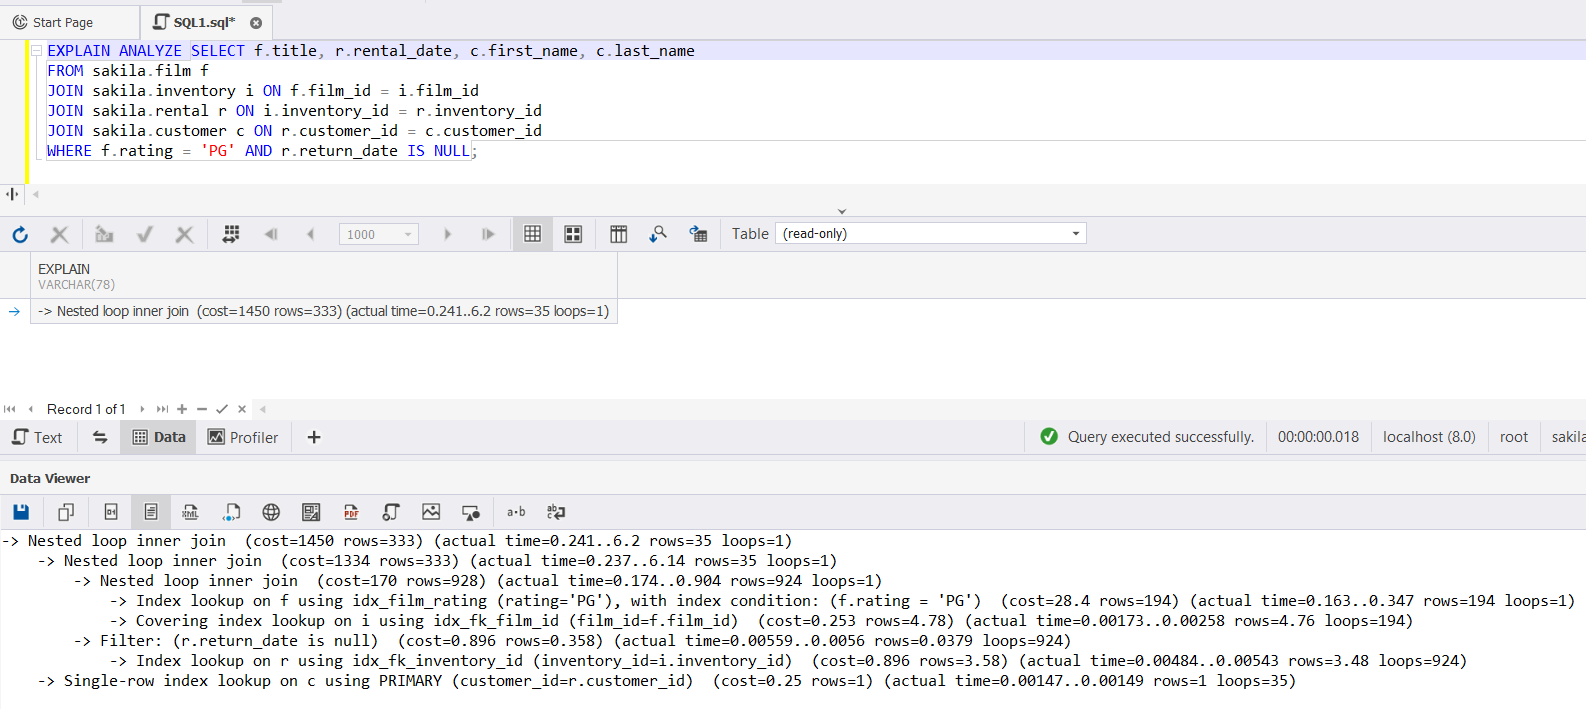
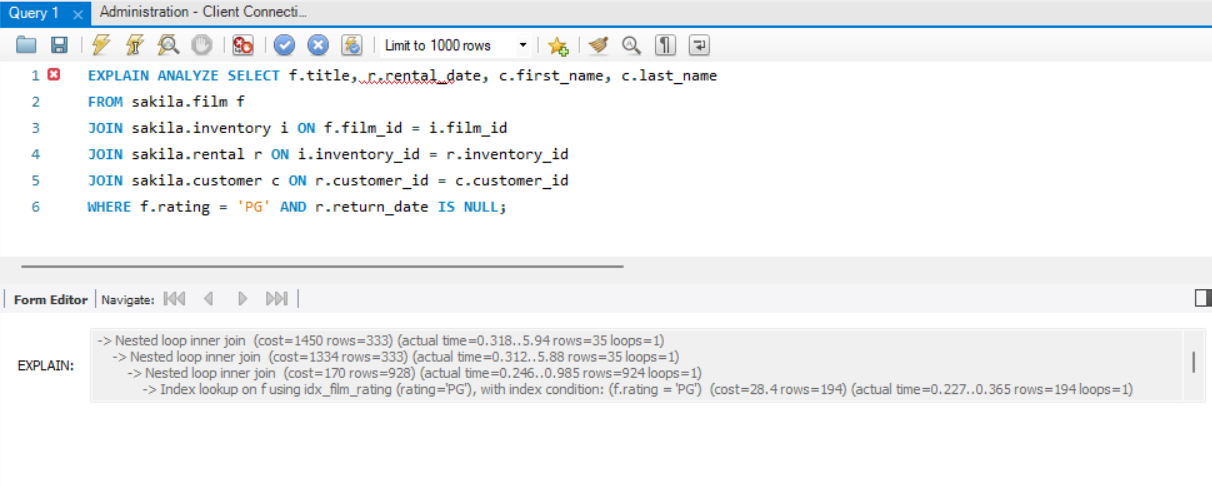
| EXPLAIN ANALYZE SELECT f.title, r.rental_date, c.first_name, c.last_name FROM sakila.film f JOIN sakila.inventory i ON f.film_id = i.film_id JOIN sakila.rental r ON i.inventory_id = r.inventory_id JOIN sakila.customer c ON r.customer_id = c.customer_id WHERE f.rating = ‘PG’ AND r.return_date IS NULL; |
Here is the output:
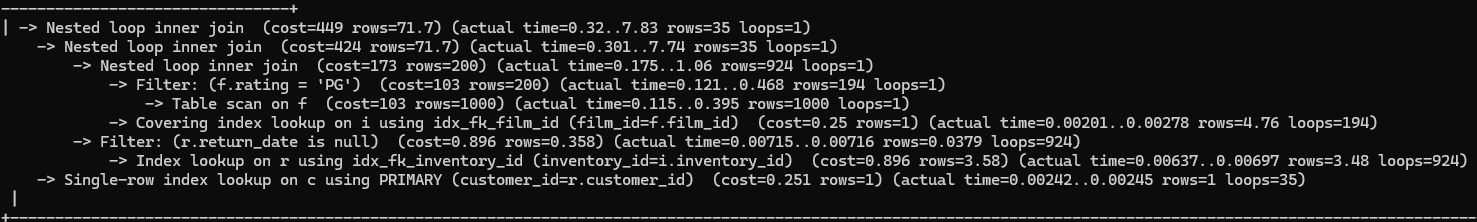
Interpreting The EXPLAIN ANALYZE Output
Let’s look at the output in detail.
- Nested loop inner join:
- cost: This gives the estimated cost to execute this part of the query. Cost is an arbitrary metric and as you would expect a lower cost indicates a more efficient plan.
- rows: The estimated number of rows that will be involved in this step.
- actual time: As you’d expect this is the actual time taken to execute this step. It is presented as a range so actual time=0.219..6.7 means it will take between 0.219 seconds and 6.7 seconds.
- actual rows: This is the actual number of rows processed in this step (e.g., rows=35). This can be a useful place to start when it is substantially different to the estimated number of rows.
- loops: This shows the number of times this step is executed, so in this case once as loops=1. Multiple loops can indicate repetitive processes which would benefit from being optimised.
- f.rating: This gives the condition applied to filter rows from the film table, in this case where the rating is ‘PG’.
Comparing EXPLAIN and EXPLAIN ANALYZE
The EXPLAIN and EXPLAIN ANALYZE commands provide different insights.
| Feature | EXPLAIN | EXPLAIN ANALYZE |
| Execution Plan | Estimated plan based on statistics | Actual plan with real-time performance data |
| Execution Time | Estimated cost | Actual time taken for each query step |
| Row Counts | Estimated rows to be processed | Actual rows processed |
| Performance Bottlenecks | Identifies potential issues | Identifies actual bottlenecks |
| Data Accuracy | Based on internal optimiser statistics | Based on actual execution results |
| Usage | Initial query analysis and planning | Detailed optimisation and performance tuning |
| Loops | Not provided | Number of loops executed for each step |
In the next section, we explore two tools that can help when working with EXPLAIN and EXPLAIN ANALYZE.
Tools and Resources
There are a variety of tools that provide graphical interfaces to help you visualise query execution.
In this section we look at two of the more popular tools – dbForge Studio for MySQL and MySQL workbench.
dbForge Studio for MySQL
dbForge Studio is an environment for MySQL database development and administration. It allows you to runn and visualise EXPLAIN and EXPLAIN ANALYZE outputs so that you can tune the performance of your queries.
Let’s look at an example using dbForge Studio to optimise our simple query.
We will continue to use the Sakila database example.
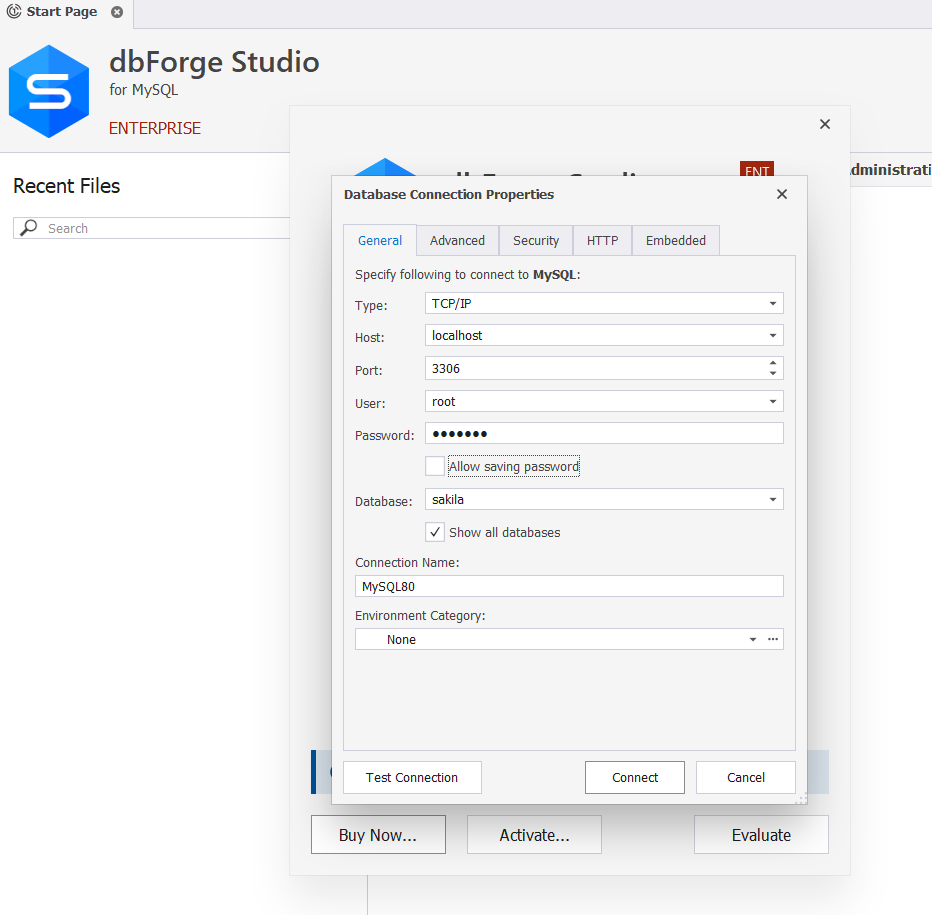
- Open dbForge Studio and connect to your database (Sakila database in this example)
- In the SQL editor, click “Query Profiling Mode” from the toolbar (highlighted in yellow below) and execute the query.
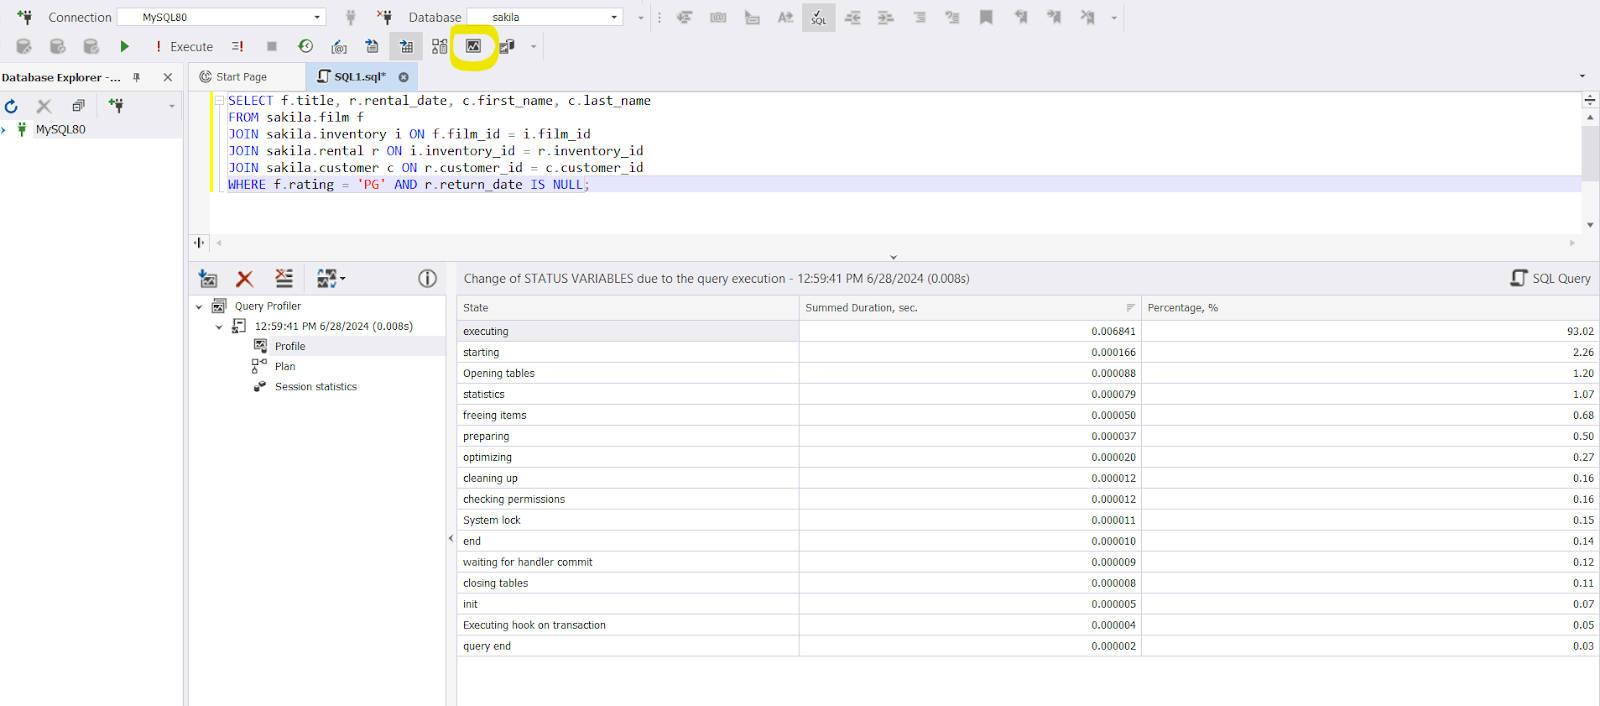
This gives you the execution time as a value and a percentage for each of the steps in your query.
Click “Plan” to see the result for your query.
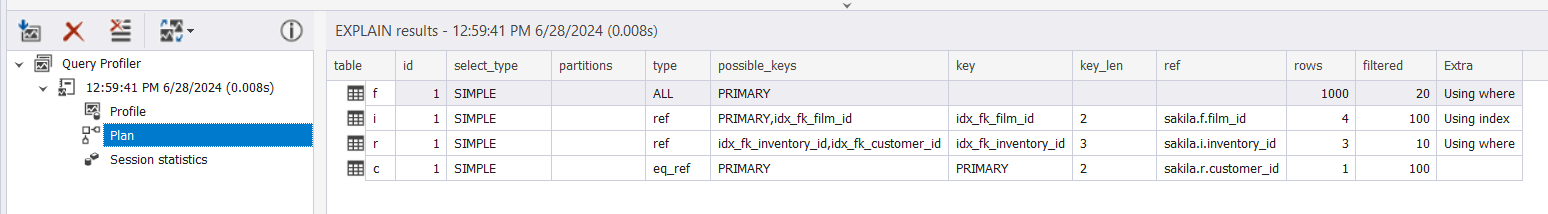
The output details the various components like the table name, type of join, possible keys, key used, key length, reference columns, number of rows examined, and additional information.
- As before, based on the EXPLAIN output you can easily identify areas for further optimisation. For example, where the output shows it is using a full table scan (type: ALL), you should think about adding an index to improve performance.
In the above query, you can add an index to the rating column in the film table.
| CREATE INDEX idx_film_rating ON sakila.film (rating); |
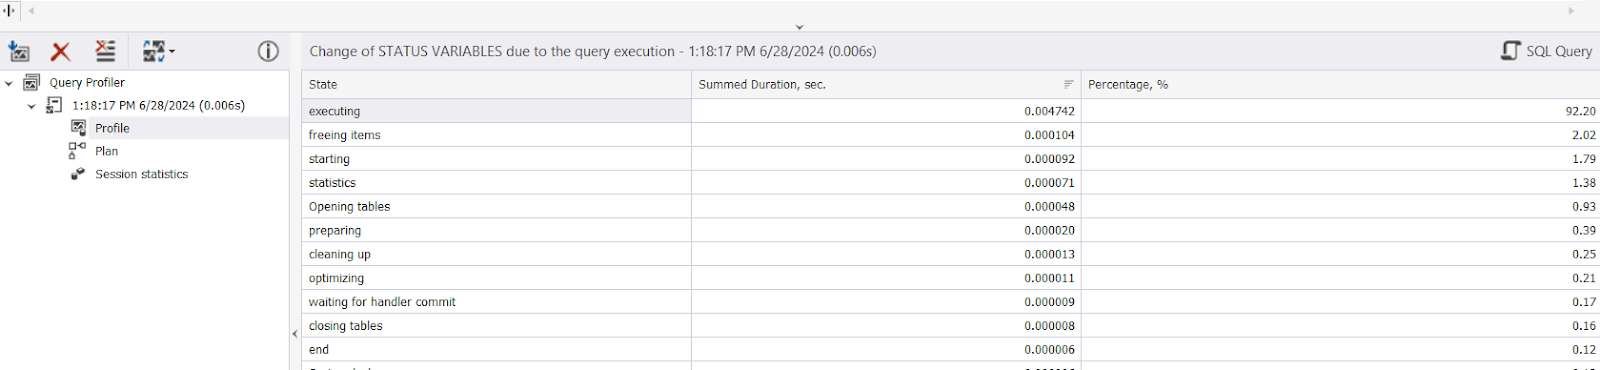
Now, if you run the SELECT query in Query Profiler Mode, you will see a reduction in the query execution time, as below:
In the same way, you can execute EXPLAIN ANALYZE to see various query statistics.
The detailed metrics come into their own when working with more complex execution plans.
Another useful feature of dbForge Studio is that it can compare multiple query execution plans with a single click.
To do this you go to the “Query Profiling Mode” and click the right-most button in the bottom tool bar. See the yellow highlight in the screenshot below.
From the dropdown menu you can select the number of last results that you want to compare. I have chosen the last two queries below to keep things simple.

Now we will run the two queries below.
Both fetch the same result, but the second query uses common table expressions.
Query1:
| EXPLAIN ANALYZE SELECT f.title, r.rental_date, c.first_name, c.last_name FROM sakila.film fJOIN sakila.inventory i ON f.film_id = i.film_idJOIN sakila.rental r ON i.inventory_id = r.inventory_idJOIN sakila.customer c ON r.customer_id = c.customer_idWHERE f.rating = ‘PG’ AND r.return_date IS NULL; |
Query2:
| WITH FilmInventory AS ( SELECT f.title, i.inventory_id FROM sakila.film f JOIN sakila.inventory i ON f.film_id = i.film_id WHERE f.rating = ‘PG’),RentalDetails AS ( SELECT fi.title, r.rental_date, r.customer_id FROM FilmInventory fi JOIN sakila.rental r ON fi.inventory_id = r.inventory_id WHERE r.return_date IS NULL)SELECT rd.title, rd.rental_date, c.first_name, c.last_nameFROM RentalDetails rdJOIN sakila.customer c ON rd.customer_id = c.customer_id; |
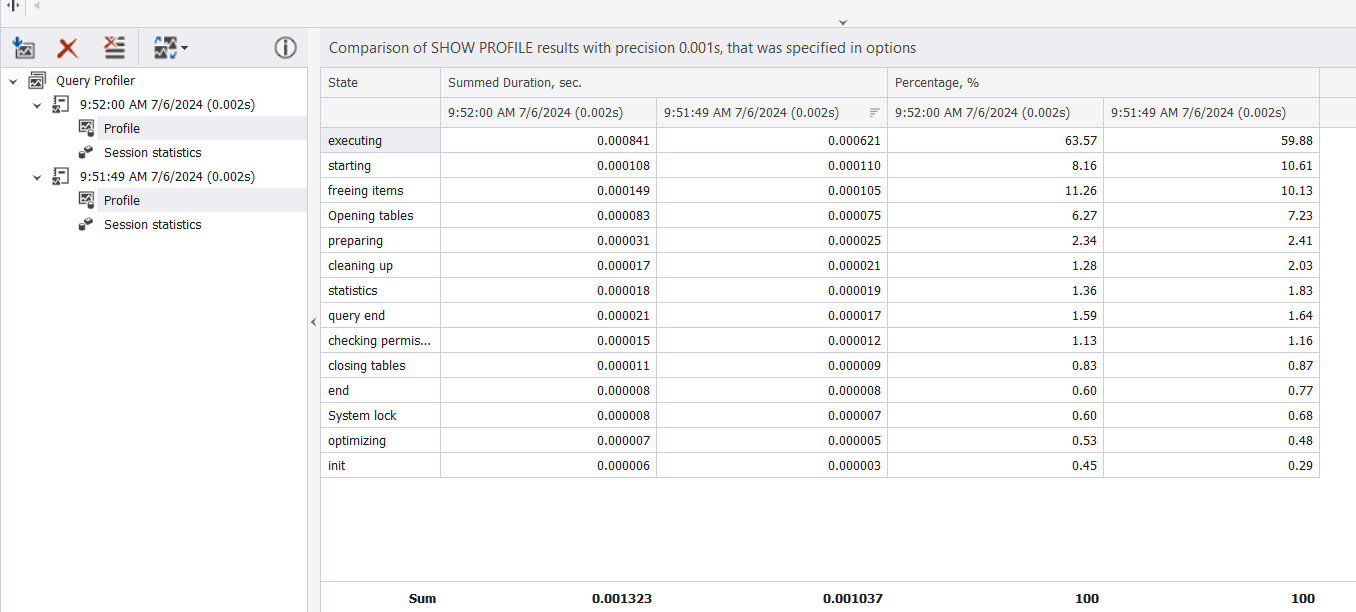
The output is below. It gives you a comparison of the execution duration and percentages for each step between the two queries.
It shows that the query that uses the common table expressions (on the left below) is slightly slower than the first query.
This handy feature isn’t available in MySQL workbench, which we will now look at.
MySQL Workbench
MySQL Workbench is another tool widely used by database architects and administrators. Again, it offers data modeling, and a full suite of admin tools.
Let’s look at how to use it to optimise the same query.
- Open MySQL Workbench and connect it to your database (Sakila database again)
- In the query editor, enter your query and click the ‘Execute The Explain Command’ button that you can find in the toolbar.
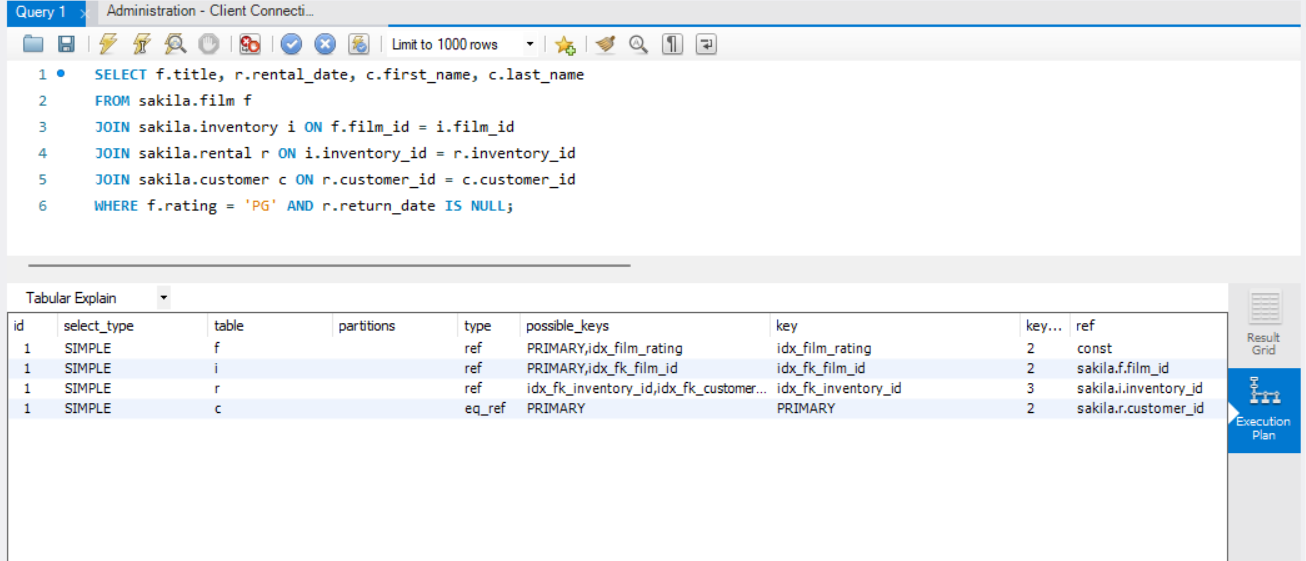
The output shows the results of the EXPLAIN command in both Tabular and Visual form.
The following figure shows the result in Tabular form.
The figure below shows the result in Visual format.
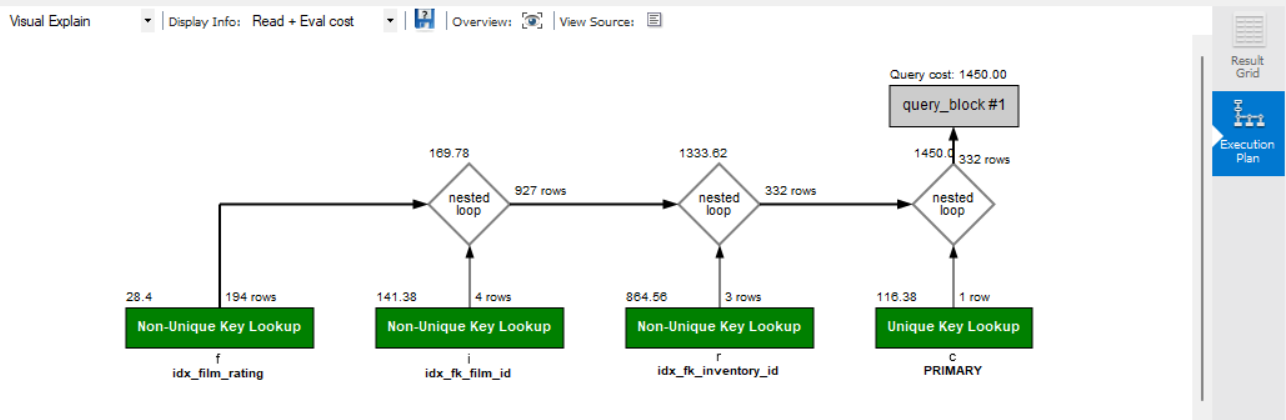
Again, both make it easy to find the most resource intensive parts of your query.
Similarly, you can run EXPLAIN ANALYZE in MySQL Workbench if you need more detailed insights.
Conclusion
Optimising queries is part of most professional database roles.
This makes EXPLAIN and EXPLAIN ANALYZE tools that are used day in and day out.
Having read this article you should now understand how to use these commands and also how to use them in dbForge and MySQLWorkbench.
Want to share your content on python-bloggers? click here.